


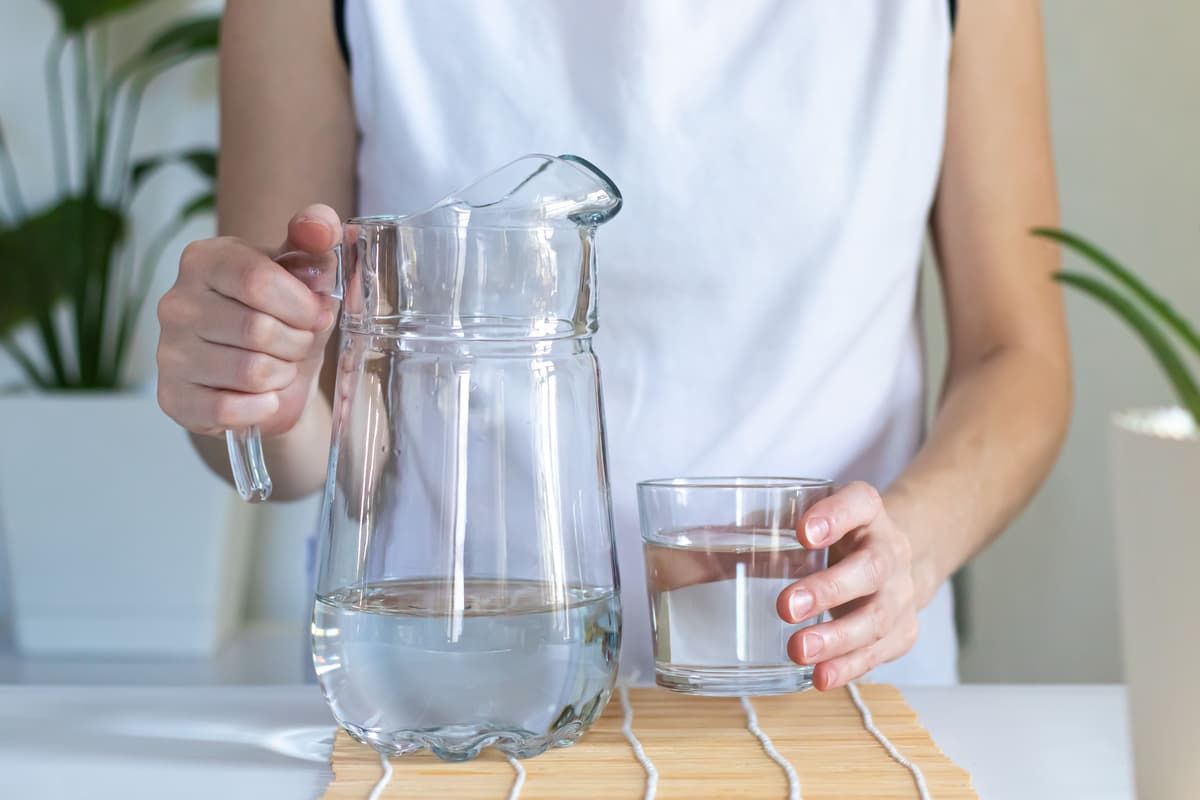
Your drinking water quality
Water quality
We keep a constant eye on the quality of the water that comes out of your tap to ensure it is safe and of high quality. Drinking water affects the health and well-being of us all, and this is why we leave nothing to chance.
There are around 120 sampling points in Tallinn and Harju County. These include kindergartens, schools, homes, and businesses, all scattered throughout the service area to ensure a complete overview of water quality in every district of the city.
All test results are publicly available on the public view of the Health Board's water safety information system. On our website, we publish the test results of drinking water leaving the treatment plant.
What do we test water for?
By testing water, we can obtain information about its key parameters, which determine the safety and taste characteristics of drinking water.
Our test results provide information on both the chemical and microbiological characteristics of water, as well as physical properties such as colour, turbidity, temperature.
You can find a description of the key parameters of drinking water here. All the parameters, indicators and analysis reports for each month can be viewed here.
Water hardness
The water hardness indicates the amount of dissolved calcium and magnesium in the water. There is no limit for the hardness of drinking water.
Hard water is not harmful to health, but it can have an impact:
- on the formation of scale,
- on the amount of soap and detergents you use,
- the lifespan of household appliances.
The hardness of the drinking water leaving the treatment plant varies seasonally, depending on the water in Lake Ülemiste. In winter and spring, the water is harder, up to 2.5 mmol/l. In summer and autumn, the hardness indicator is lower, starting at 1.8 mmol/l.
Water hardness parameters
0…0.5 mmol/l
Soft
0.5…1 mmol/l
Moderately soft
1…1.5 mmol/l
Slightly hard
1.5…2 mmol/l
Moderately hard
2…3 mmol/l
Hard
> 3 mmol/l
Very hard
Chlorine
A small amount of chlorine is added to drinking water at the water treatment plant before it is pumped into the distribution network. This ensures that the water remains clean and fresh throughout its long journey to consumer's taps.
The amount of residual chlorine in drinking water is strictly regulated:
- up to 1 mg/l in the water leaving the treatment plant,
- up to 0.5 mg/l at the consumer’s tap.
If you have more sensitive taste buds, you may sometimes notice a smell or taste of chlorine, but this is not a bad thing – on the contrary, it just shows that the water is safe.
In autumn, when the water temperature drops, you may notice the smell of chlorine more frequently because it remains in the water for longer when it is cold. Chlorinating drinking water is a standard preventive measure that helps to maintain its quality in the water network.
We regularly measure chlorine levels in various areas of the city, and residual chlorine levels typically range from 0.05 to 0.5 mg/l. All of the chlorine measurement results in 2025 remained within the standards set for drinking water.
Tip
If the chlorine smell seems strong, pour the water into a jar and leave it to stand for a while. Chlorine evaporates when it comes into contact with oxygen. Alternatively, you can fill the bottle with tap water and put it in the fridge to keep the water cool and fresh.
Lead
The public water mains in Tallinn are made of modern and safe materials, such as plastic, steel or cast iron.
The use of lead as a material for water pipes ended at the beginning of the 20th century. Until then, it was only used for house connections alongside steel and cast iron. The vast majority of buildings and pipes in Tallinn were built much later, when lead was no longer used as a material for house connections.
Unfortunately, we lack precise information on the materials used for old house connections installed before the early 20th century, and these materials are often only revealed during excavations. If, while working to fix a water incident, we identify that a lead pipe has been used in the house connection, we will replace that section with a water pipe made of a modern material.
However, a number of sampling exercises have shown that the lead limit in the water can only be exceeded if the water is left sitting in the pipes for a long period of time, i.e. if it is not used.
If you suspect that your house connection or a section of the pipes inside the building may be made of tin, follow these steps. Before using water from the tap for drinking or cooking in the morning, let the water run for a while (about a minute or longer, depending on the system), to replace the water that has been sitting in the building overnight with fresh water from the network.
Coliform bacteria
The presence of isolated coliform bacteria in drinking water is an indication that the water has been sitting in the pipes for a while.
This is an indicator parameter and drinking such water does not usually cause malaise in a person with normal immunity.
However, if coliform bacteria are found in tap water, we recommend boiling it before drinking or temporarily using bottled water to eliminate any risk.
Read the recommendations from the Health Board.
Turbidity
Following maintenance work on the water pipes, the tap water may temporarily appear cloudier than usual. The turbidity is caused by sediment starting to move in the pipes, which is a common phenomenon after a water main has been flushed or repaired. The turbidity will disappear after a short flushing. Once the work is finished, the local mains are flushed thoroughly and the water is tested for turbidity.
Which minerals can you find in drinking water?
Laboratory tests on tap water in Tallinn show that drinking two litres of water a day covers:
- 13% of your daily calcium need,
- 5.2% of your magnesium need,
- 1.1% of your sodium need.
| Parameter | Average concentration in drinking water | Average amount in 2 l of drinking water | Average daily intake recommendations | % of daily need |
|---|---|---|---|---|
| ParameterPotassium, K | Average concentration in drinking water2.5 mg/l | Average amount in 2 l of drinking water5.0 mg | Average daily intake recommendations3,500 mg | % of daily need 0.1% |
| ParameterCalcium, Ca | Average concentration in drinking water67 mg/l | Average amount in 2 l of drinking water134 mg | Average daily intake recommendations1,000 mg | % of daily need 13% |
| ParameterMagnesium, Mg | Average concentration in drinking water8.0 mg/l | Average amount in 2 l of drinking water16.0 mg | Average daily intake recommendations300 mg | % of daily need 5.3% |
| ParameterSodium, Na | Average concentration in drinking water8.5 mg/l | Average amount in 2 l of drinking water17.0 mg | Average daily intake recommendations1,500 mg | % of daily need 1.1% |
| ParameterManganese, Mn | Average concentration in drinking water0.005 mg/l | Average amount in 2 l of drinking water0.010 mg | Average daily intake recommendations3.0 mg | % of daily need 0.3% |
How to improve your water quality?
Flushing by letting the water run is an effective way to improve water quality because it speeds up the replacement of water in the pipes.
To this end, we also recommend leaving taps open for short periods at remote points of consumption on the network.
You should also check the water metering unit on your property. If you have installed filters, they will certainly need to be maintained or replaced periodically.
What water quality concerns do people come to us with?
In 2025, 55 consumers contacted us with concerns about the quality of their drinking water. Most of these enquiries were related to cloudiness in the water following the shutdown or flushing of water mains. A smaller number of enquiries concerned the detection of lead or coliform bacteria, as well as low water pressure.

